Software Development
Observability in Cloud-Native and Serverless Applications: Tools, Metrics, and Best Practices

Introduction to Observability for Cloud-Native and Serverless Applications
Modern observability is designed to address the growing complexity of cloud-native and serverless architectures. Unlike traditional monitoring, which was developed for monolithic and static environments, the current approach integrates metrics, tracing, and logging to ensure comprehensive visibility over ever-evolving systems. In an ecosystem where resources and services are quickly created and destroyed, legacy tools and practices are no longer sufficient.
Distributed environments present new challenges: correlating metrics, logs, and traces is essential to identify bottlenecks and understand flows between microservices or serverless functions, such as AWS Lambda. A unified approach to observability not only allows for real-time anomaly detection but also anticipates problems and enhances application resilience.
For us at Astrorei, investing in a modern observability strategy means providing our clients with advanced tools and specialized expertise for proactive control. Promoting an internal culture oriented towards continuous learning and innovation is the foundation for ensuring performance and reliability in cloud-native environments.
Key Tools for Observability: OpenTelemetry, Prometheus, and Grafana
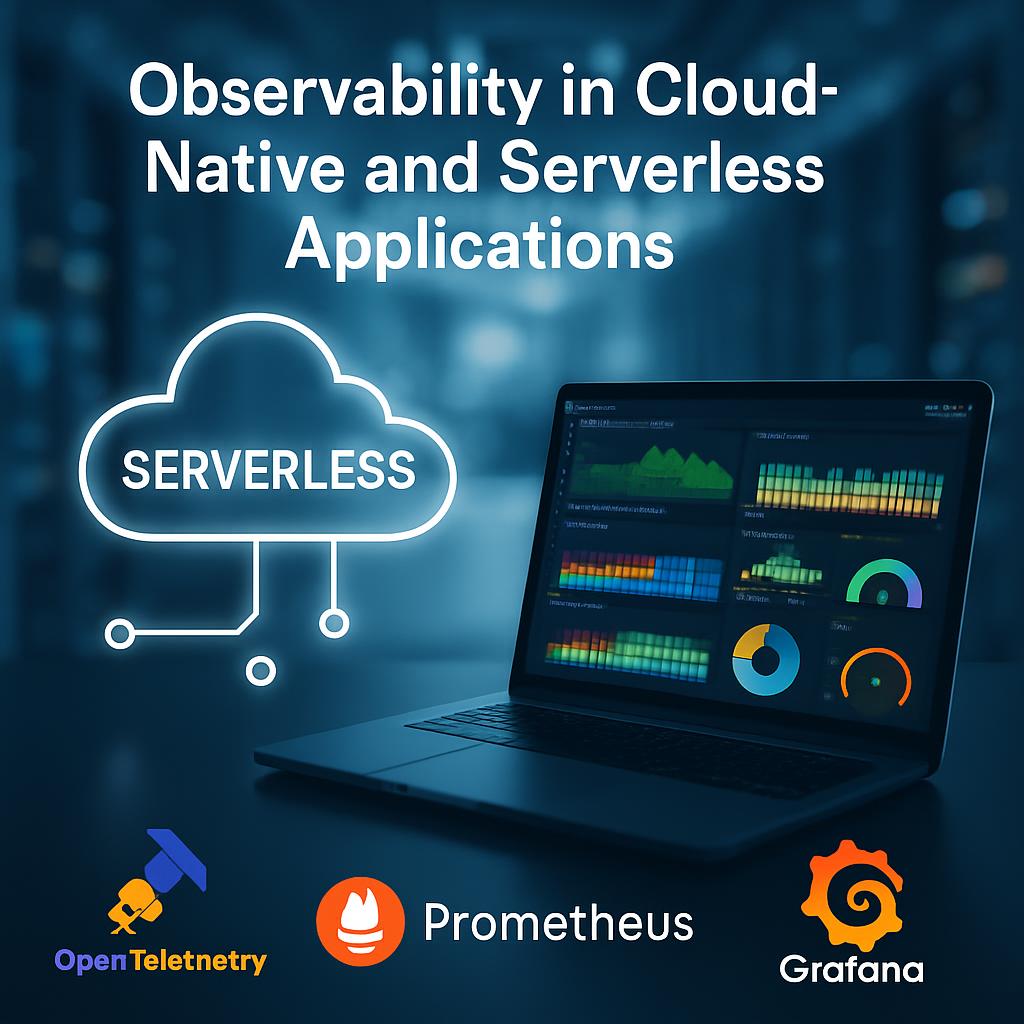
To ensure effective observability in cloud-native and serverless environments, tools like OpenTelemetry, Prometheus, and Grafana are essential for DevOps and SRE teams. OpenTelemetry provides a unified and vendor-agnostic framework for collecting metrics, traces, and logs from distributed applications, facilitating integration with different backends and platforms.
Prometheus excels in collecting, storing, and querying time-series metrics, making it ideal for real-time monitoring of specific components in distributed architectures. With its native compatibility, Prometheus seamlessly integrates with Grafana, which offers interactive and customizable dashboards for data visualization.
A practical example is the implementation in ASP.NET Core environments: OpenTelemetry collects metrics and traces, Prometheus handles centralized collection, and Grafana enables the creation of intuitive dashboards. Best practices suggest defining consistent metrics, using tags correctly for correlation, and proactive alerting on SLI/SLO. Integrating these tools simplifies problem diagnosis, maintaining optimal performance even in complex architectures.
To delve deeper into Agile development and DevOps methodologies, we recommend reading our dedicated article here.
Metrics and Best Practices for Monitoring Serverless Applications
Monitoring serverless applications requires attention to specific metrics such as cold start duration, memory usage, response times, and error rates. For a comprehensive view of performance, it is essential to continuously gather this data, unifying logs, traces, and metrics from each invocation into a real-time dashboard, with automatic alerts set on critical SLOs.
Best practices include using custom metrics generated through traces or logs, analyzing memory patterns with limits adjusted in 128MB increments, and monitoring package sizes before deployment. Serverless functions should focus on specific tasks, importing only necessary modules and optimizing cold start management with targeted mitigation techniques.
Distributed tracing allows tracking each request end-to-end across microservices, even in the presence of ephemeral components, using correlation IDs that link events between functions and centralized logging that facilitates troubleshooting and audit trails. These practices, integrated with tools like AWS CloudWatch or specialized solutions, form the basis for effective and innovative monitoring.
Challenges and Observability Strategies for Cloud-Native Scale and Complexity
Managing observability at scale in cloud-native environments poses challenges such as high cardinality of metrics and the vast amount of data generated by microservices and serverless infrastructures. These scenarios impact both storage costs and query performance, making strategies of aggregation, compression, and smart sampling essential for sustainability and efficiency.
The heterogeneity of microservices, often developed in different languages, complicates uniform instrumentation. Integrating service mesh like Istio or Linkerd simplifies this complexity: through sidecar proxies and standardized protocols like OpenTelemetry, centralized collection of logs, metrics, and traces is ensured without the need for application code changes. Adaptive sampling techniques and distributed monitoring maintain visibility over dynamic and polyglot architectures.
Adopting SLIs and SLOs enables the translation of raw data into relevant business metrics, while intelligent alerting systems prevent objective violations, ensuring predictable performance. Astrorei supports companies in adopting these best practices, developing tailored solutions oriented towards reliability, operational transparency, and continuous growth.
Conclusion and Astrorei's Added Value in Customized Observability Solutions
In this article, we explored the tools, metrics, and best practices essential for ensuring effective observability in cloud-native and serverless environments.
Astrorei stands out for its ability to design and implement customized observability solutions, integrated into Agile processes and developed by a team of highly qualified professionals. Thanks to our experience in supporting DevOps, SRE, and infrastructure architect teams, we offer proactive monitoring that anticipates anomalies and optimizes application performance.
Relying on Astrorei means choosing a technology partner that values cross-disciplinary skills, promotes continuous collaboration, and leverages advanced methodologies to ensure efficiency, scalability, and innovation.
To find out how Astrorei can help your company improve observability and manage cloud-native systems, visit our page dedicated to DevOps services and solutions here. Contact us for a customized consultation and take your infrastructure monitoring to the next level.

Andrea Bellomia
You might be interested in
Talk to our experts
START YOUR FREE PROJECT DESIGN
Tell us about your project, we'll give you a clear roadmap.
One of our experts will contact you within 24 hours with an initial free assessment.
